Test Dna Feature Viewer
less than a minute
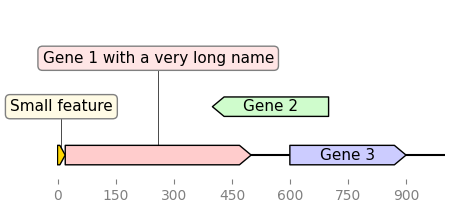
from dna_features_viewer import GraphicFeature, GraphicRecord
features=[
    GraphicFeature(start=0, end=20, strand=+1, color="#ffd700",
                   label="Small feature"),
    GraphicFeature(start=20, end=500, strand=+1, color="#ffcccc",
                   label="Gene 1 with a very long name"),
    GraphicFeature(start=400, end=700, strand=-1, color="#cffccc",
                   label="Gene 2"),
    GraphicFeature(start=600, end=900, strand=+1, color="#ccccff",
                   label="Gene 3")
]
record = GraphicRecord(sequence_length=1000, features=features)
record.plot(figure_width=5)
(<Axes: >,
 ({GF(Small feature, 0-20 (1)): 0,
   GF(Gene 1 with a very long name, 20-500 (1)): 0,
   GF(Gene 2, 400-700 (-1)): 1.0,
   GF(Gene 3, 600-900 (1)): 0},
  {GF(Gene 1 with a very long name, 20-500 (1)): {'feature_y': 0,
    'annotation_y': 2.0},
   GF(Small feature, 0-20 (1)): {'feature_y': 0, 'annotation_y': 1.0}}))